*Key U.S. regional manufacturing sentiment indexes have surged passed expectations in early 2020, reflective of the easing of trade tensions that spiked uncertainty over the last two years, and are seemingly resilient thus far to the threat of the coronavirus (COVID-19). It is too early to determine the spillover effects from the coronavirus via disruptions in supply chains and trade, and drop-off in demand from China, but the improvement in sentiment thus far is worth noting (China’s economy: after the fall, what kind of recovery?, February 19, 2020).

*The Philadelphia Fed manufacturing index more than doubled in February to 36.7 from 17.0 previously, the highest level since February 2017 and seven of its nine underlying subindexes increased, and the Empire State manufacturing index increased by 8.1pts to 12.9 in February, the highest level since May 2019 (Chart 1).

*The surveys provided a mixed picture on future manufacturing activity -- the six-month-ahead general business conditions index in the Philadelphia Fed manufacturing survey jumped by 7pts to 45.4, the highest level in two years, but declined in the Empire State manufacturing survey by 0.7pt to 22.9 (Chart 2).


The ISM-adjusted Philadelphia Fed manufacturing index (average of new orders, shipments, employment, supplier delivery times, and inventories indexes), which better reflects current underlying manufacturing conditions than its headline sentiment index, increased by 3.3pts to 58.0 (>50 = expansion territory), due to sizable increases in its news orders (+15.4pts to 33.6) and inventories indexes (+14.1pts to 11.8). Its shipments index increased to 25.2, the highest since June 2018, but its average workweek index remained fairly low, despite doubling to 10.3. See Chart 3.


The ISM-adjusted index for the Empire State manufacturing survey increased by 4.8pts to 56.9 due to large increases in four of its five underlying indexes: new orders (+15.5pts to 22.1), shipments (+10.3pts to 18.9), supplier delivery times (+11pts to 8.3), inventories (+13.6pts to 12.9).


Growth in manufacturing employment (totaled a slight 26k over the last 12 months) likely remained weak in February despite the marked improvement in sentiment. The Empire State manufacturing’s number of employees index declined by 2.4pts to 6.6, a six-month low, and the Philadelphia Fed’s employment index declined by 9.5pts to 9.8 (Chart 4).


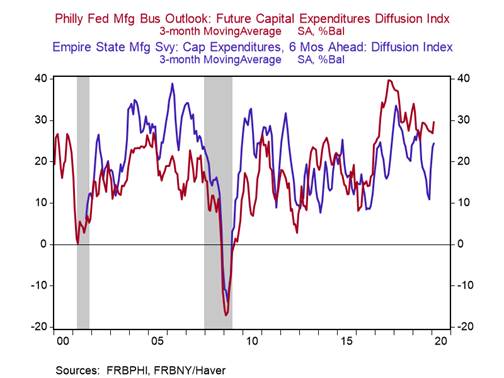
Respondents to the Philadelphia Fed manufacturing survey marked up expectations for six-month ahead new orders (+12.1pts to 54.0), shipments (+9.5pts to 51.9), and the average workweek (+13.6pts to 26.8), while the capex index (-3.1pts to 29.8) – reliable leading indicator for business fixed investment –declined but remained fairly elevated. The details of the six-month-ahead section of the Empire State manufacturing survey were softer than the current conditions section, with 10 of 11 subindexes declining, but its future capex and technology spending indexes remained at solid levels (Chart 5).


Taken together, the details of these two regional manufacturing sentiment surveys suggest that a rebound in U.S. factory floor activity is well under way.


Chart 1:


Chart 2:


Chart 3:


Chart 4:


Chart 5:
 

Roiana Reid, [email protected]


Member FINRA & SIPC

This email and any files or attachments transmitted with it may contain confidential or privileged information and are intended solely for the use of the intended recipient. If you are not the intended recipient, please do not copy, retain, disclose or use any part of the message or its attachments. Please notify the sender immediately by return email and destroy or delete any copies. Dissemination or use of this information by anyone other than the intended recipient is unauthorized and may be illegal. Communications by email cannot be guaranteed to be secure or error-free. Emails and their attachments are subject to being intercepted, becoming corrupted, getting lost or delayed, or may contain viruses. Therefore, neither the sender nor Berenberg Capital Markets LLC (BCM) accepts any liability for any errors or omissions in the content of this message or problems in its transmission, including those arising as a result of its transmission over the internet.

BCM does not assume liability for the correctness and completeness of all information given and/or attachments contained herein. The provided information has not been checked by a third party, especially an independent auditing firm. BCM explicitly points to the stated date of preparation. The information given can become incorrect due to passage of time and/or as a result of legal, political, economic or other changes. BCM does not assume responsibility to indicate such changes and/or to publish an updated document. Any document(s) or attachment(s) is meant exclusively for institutional investors and market professionals, but not for private customers. It is not for distribution to or the use of private investors or private customers.

In light of upcoming regulatory changes, please be informed that BCM will continue to share information with you until [email protected] receives your termination/deletion request. For more information about the General Data Protection Regulation (GDPR) and our privacy policies please refer to https://www.berenberg-us.com/legal-notice. BCM reserves all the rights in this communication. No part of this communication or its content may be rewritten, copied, photocopied or duplicated in any form by any means or redistributed without BCM’s prior written consent.

The information contained herein and sourced may have been adopted from various news sources, for example, Bloomberg, Reuters, Street Account and various other sources. BCM does not claim accuracy, completeness, timeliness, suitability, or otherwise regarding all the information on the securities, stock markets, or developments referred to within. On no account should the Content be regarded as a substitute for the recipient procuring information for himself/herself or exercising his/her own judgments. BCM is not responsible for any recipient(s) use of this information. This Content is not a solicitation or an offer to buy or sell any of the securities contained herein. This information does not constitute a recommendation or take into account the particular investment objectives, financial situations, or needs of clients. Clients should consider whether any advice or recommendation in this Content is suitable for their particular circumstances and, if appropriate, seek professional advice, including tax advice. The price and value of securities which may be referred to in this Content and the income from them may fluctuate. Past performance is not a guide to future performance, future returns are not guaranteed, and a loss of original capital may occur. Fluctuations in exchange rates could have adverse effects on the value or price of, or income derived from, certain securities.