| This Strategy Crushed Buy-and-Hold... Here's How to Use It Now | | By Ben Morris, editor, DailyWealth Trader | | Friday, March 2, 2018 |
| Today, I'm sharing one of the most important stock market studies you'll see all year.
It demonstrates a powerful idea... And the result is a simple and effective way to outperform the benchmark indexes AND avoid some of the worst stock market declines in history.
If you're nervous about being in stocks today, this issue is for you...
----------Recommended Links---------
---------------------------------
The study involves the benchmark S&P 500 Index and its 200-day moving average (or "200-DMA")...
A lot of professionals use the 200-DMA to size up a market's long-term trend. It works by collecting an asset's closing prices from the past 200 days, then taking the average of those prices. This produces a chart line that "smoothes out" market volatility.
During bull markets, assets tend to spend most of their time above the 200-DMA. During bear markets, they spend most of their time below it.
But today, we're looking at something even more important...
The 200-DMA itself is the long-term trend. And it acts like a magnet. Whether it's moving higher or lower, assets tend to have a hard time going in the opposite direction for long.
So unless you're looking at a short-term trade, you rarely want to bet that an asset will move lower when its 200-DMA is moving higher, and vice versa.
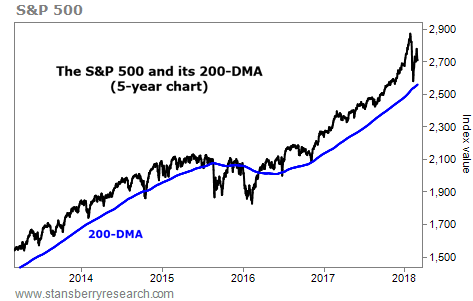
If you're not familiar with the 200-DMA, this is what it looks like plotted on a five-year chart. You can see that it doesn't jolt around like the S&P 500 does. And it rarely changes direction...
Now, I could just tell you that you want to own stocks when the 200-DMA is rising and sell your stocks when it starts to fall. But the proof is too powerful to not include it...
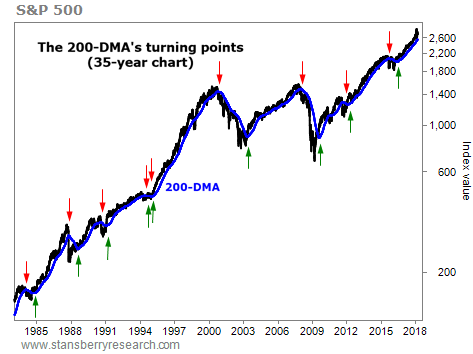
Last week, I took a look back at what happened any time the 200-DMA changed direction over the last 35 years. In order to weed out insignificant changes, I only counted the shifts in which the 200-DMA rose or fell every trading day for a full month.
This only happened 18 times over that period. Some of these changes preceded huge bull and bear markets.
In the chart below, I've marked these 18 occasions. This could be one of the most valuable pictures you see all year. The red arrows show "sell points" – times when the 200-DMA turns lower for at least a month. And the green arrows show "buy points" – times when the 200-DMA turns higher for at least a month...
What would have happened if you bought stocks at the green arrows and sold at the reds?
The chart starts on December 31, 1982... just a shade over 35 years ago. Here's how you would have done if you put $10,000 into the S&P 500 that day, and used this simple buy and sell system after that (through the study date, last week). Keep in mind, this doesn't include dividends...
| Entry Date | Exit Date | Return | $10,000 Invested | | 12/31/1982 | 3/5/1984 | 12.3% | $11,227 | | 12/4/1984 | 11/19/1987 | 46.9% | $16,495 | | 8/31/1988 | 9/14/1990 | 21.1% | $19,983 | | 3/1/1991 | 7/14/1994 | 22.4% | $24,457 | | 9/19/1994 | 11/29/1994 | -3.3% | $23,643 | | 2/10/1995 | 11/3/2000 | 196.3% | $70,060 | | 5/30/2003 | 2/4/2008 | 43.3% | $100,395 | | 8/31/2009 | 11/29/2011 | 17.1% | $117,567 | | 4/4/2012 | 9/21/2015 | 40.6% | $165,302 | | 6/24/2016 | 2/20/2018 | 33.3% | $220,380 | | Total return: 2,104% |
Aside from one little fake-out in 1994, every buy point resulted in a double-digit gain or more.
You would have multiplied your money 22-fold, turning $10,000 into more than $220,000 – a 2,104% return. That's a fantastic result.
Here's what you would have missed by selling your stocks at the red arrows, rather than holding all the way through...
| Exit Date | Entry Date | Return | | 3/5/1984 | 12/4/1984 | 3.5% | | 11/19/1987 | 8/31/1988 | 8.9% | | 9/14/1990 | 3/1/1991 | 16.9% | | 7/14/1994 | 9/19/1994 | 3.8% | | 11/29/1994 | 2/10/1995 | 5.8% | | 11/3/2000 | 5/30/2003 | -32.5% | | 2/4/2008 | 8/31/2009 | -26.1% | | 11/29/2011 | 4/4/2012 | 17.0% | | 9/21/2015 | 6/24/2016 | 3.6% | | Average return: 0.1% |
You would have missed some single-digit gains and a couple of 17% gains. But you also would have missed the worst part of two brutal bear markets – 32.5% losses during the dot-com bust, and 26.1% losses during the financial-crisis bust.
That's a huge amount of avoided stress. Plus, it would have freed up your cash for other opportunities.
What would have happened if you simply bought stocks on December 31, 1982 and held all the way through to February 20?
A buy-and-hold strategy would have delivered a 1,831% gain – 272 percentage points less than our 200-DMA buy-and-sell strategy. And you would have had your money tied up in stocks for an additional 7.5 years (four of which were no fun at all).
So what do you do with this information?
I don't recommend sticking to this 200-DMA system strictly (although you could do a lot worse). Instead, I consider this a guide for our trading and investing behavior...
As you saw in the first chart today, the 200-DMA is still on the rise. It's nowhere near a turning point. So we know we still want to own stocks and make bullish trades.
As long as the trend is up, we see little reason to change our medium- or long-term outlook.
It's a bull market. So stay long.
Good trading,
Ben Morris
Editor's note: Ben recently highlighted an investment in one of the market's most attractive sectors right now. These stocks are part of a sweeping trend that nearly every business must grapple with today. "If you're not profiting already, get on board," he says. To learn more about his DailyWealth Trader service – and how to access this recommendation – click here. |
Further Reading:
"This metric provides some great clues about where we are in the stock market," Steve writes. He's talking about a key economic signal – one that has predicted the last three major crashes in the U.S. Learn more here. "History says further gains – and new all-time highs – are likely ahead of us," Brett Eversole says. The recent correction could actually be a good sign for stocks in the coming months... Read more here. |
|

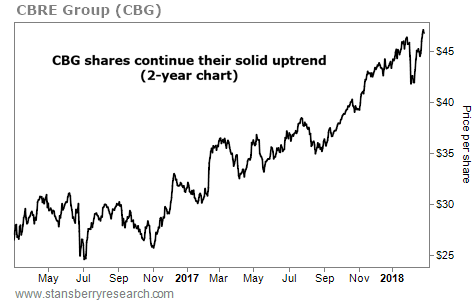
A 'PICKS AND SHOVELS' WINNER IN COMMERCIAL REAL ESTATE
Today's chart highlights the reliability of one of our favorite trading strategies... Regular DailyWealth readers know that we're fans of "picks and shovels." These are the companies that provide the vital goods and services to other companies in their industry, without betting the future of their business on a single project. As a result, their stocks rise and fall with the success or failure of their entire sector. Take, for instance, CBRE Group (CBG). The $16 billon company does the property-management groundwork for real estate owners, handling everything from collecting rent and making repairs to offering appraisals and brokerage services. This might not be as exciting as building skyscrapers... but it can be just as lucrative and far less risky. As you can see in the chart below, business is booming... CBG shares have climbed nearly 30% over the past year, and recently hit a new all-time high. It's proof that the saddle-maker wins no matter which horse finishes first... |
| 
Earn a 4% dividend betting on this tobacco giant... U.S. stocks are still in an uptrend today. That means we want to stay long. In a special report, Dave Eifrig has outlined one company he believes will thrive over the long term... |
Are You a
New Subscriber?
If you have recently subscribed to a Stansberry Research publication and are unsure about why you are receiving the DailyWealth (or any of our other free e-letters), click here for a full explanation... |
|
Advertisement
According to Fortune magazine, thousands of Americans will become millionaires every day over the next few years... thanks in part to a prediction Steve Sjuggerud made way back in 2015. For the full story, click here. |

| Double-Digit Upside Ahead for U.S. Stocks | | By Brett Eversole | | Thursday, March 1, 2018 |
| | The Dow is only a few percentage points away from new highs today. And history says it should reach them soon... |
| | This Profitable Investing Strategy Is About to Make a Comeback | | By Dan Ferris | | Wednesday, February 28, 2018 |
| I've warned about the ongoing stock market mania since May last year. And if you've ever wondered what comes after the mania and its inevitable crash, this is the answer... |
| | Interest Rates Are About to Go... DOWN? | | By Dr. Steve Sjuggerud | | Tuesday, February 27, 2018 |
| | It doesn't matter what the investment is – whenever you see EVERYONE betting the same direction on a trade, that trade is typically almost over... |
| | Your Financial Adviser Is Lying to You | | By Dr. Steve Sjuggerud | | Monday, February 26, 2018 |
| | I HATE IT when I get letters like the one below... because I hate it when people try to mislead our subscribers... |
| | The 'Debt Jubilee' Is Getting Mainstream Attention | | By Justin Brill | | Saturday, February 24, 2018 |
| | Americans continue to borrow like mad. But this trend is unsustainable... |
|
|
|
|