Watch our controversial new video report — NOT ZERO — now…People are already starting to wake up to what The Daily Telegraph calls the ‘lunacy’ of the carbon neutral project. Several countries have already ditched aggressive anti-fossil-fuel policies and gone back to traditional fossil-fuel energy. Oil and gas stocks have responded in kind. But according to Greg Canavan, we haven’t reached the tipping point…yet. If you want to get ahead of the curve on this story…watch our new video here… |
|
| The RBA is Whacking the Wrong Mole — You |
Saturday, 16 September 2023 — South Melbourne  | | By Nickolai Hubble | | Editor, The Daily Reckoning Australia |
|
[10 min read] | Quick summary: Central bankers are focusing on wages in their fight against inflation. But what if that’s the wrong mole to whack? A debt crisis is popping up behind them… |
|
Dear Reader, Imagine a game of whack-a-mole where the moles can whack back. It sounds like some sort of Japanese game show. But it’s actually what central bankers at the Reserve Bank of Australia are playing at. The latest round of the steadily escalating game began when COVID struck. With inflation, GDP, the financial system and unemployment all chugging along reasonably well, our central bank suddenly faced a real ugly threat in the form of the pandemic. ‘COVID is coming, look busy’ was the mantra of public institutions everywhere…except schools, which got busy not looking busy. Central bankers sprung into action in all sorts of weird and wonderful ways to ensure the economy, financial system and government all had enough money to deal with the crisis. The result was, of course, inflation. Because that is what happens when you inflate the money supply. Only this time, the inflation showed up in consumer prices too, not just the stock market, property market and bond market like usual. That is the point of whack-a-mole, after all. Every time you solve one problem, another one pops up. And so the RBA grabbed its interest hammer, if a bit slowly, and slammed inflation on the head. Of course, the RBA wasn’t the only one playing the game. In much of the Western world, inflation reached double digits before getting a hammering. Central bankers initially denied its existence for a dangerously long time and almost lost the game completely as a result. Then they pivoted to denying they were responsible for the inflation, but could solve it by hiking interest rates nevertheless. This should give you pause for thought in and of itself. I mean, if too Lowe interest rates are not responsible for the inflation we got, as many central bankers still maintain, then how could hiking rates reign it in? Anyway, having successfully beaten inflation back down…to some extent…with record interest rate hikes, central bankers are now facing a new mole that has popped up to replace it. This mole is about 50 years old and unusually grizzly looking to central bankers because it pulled their pants down when it first made its appearance back in the 70s. We’re talking about the dreaded wage-price spiral. When you hear central bankers say rather unusual things, such as the need to inflict pain on you, the need to admit we are poorer, and the need to avoid pay increases despite inflation, what they are referring to is the wage-price spiral. They want to prevent it from popping out of its hole in the first place, because it’s unusually difficult to whack back down. The wage-price spiral story, which is a load of rubbish by the way, goes a little something like this: Inflation is driven by wages. If wages go up, prices go up. Simple, right? The one-armed economists who came up with this idea forgot that, while wages and therefore spending power is going up on the one hand, on the other hand this implies more is being produced. More stuff and more money combined doesn’t mean prices will go up. Unless, of course, wages are merely going up to keep up with prices that are rising. Which is obviously what’s going on today. But, if there’s one thing I learned at university, it’s ‘don’t let reality butt in when you’re trying to explain theory’. Instead of seeing that wages are merely rising to keep pace with inflation, central bankers are worried that rising wages will force or cause companies to raise prices. Facing such higher prices, workers will demand more pay. And this will only bid up prices even more. The result is a self-reinforcing spiral of inflation fuelled by higher wages. Again, this is flawed because things cannot get out of hand in this way when the amount of money in the economy isn’t surging out of control. The money to pay for all this must, after all, come from somewhere. Indeed, this was the key flaw in the RBA’s initial promise not to raise interest rates until wages rose. They simply presumed that wages were behind inflation, instead of…well…inflation off the money supply causing inflation. But that’s not my point. Central bankers are busily trying to whack the wage-price spiral to stop it from even popping its head out. And, right now, they think they’re failing. In the UK, wages recently rose by an all-time record amount. Japan’s wages recently jumped by the most in 26 years. Last year, US wage growth soared to record highs on measures going back to the 90s. Various measures for Australian wages are also taking off...in nominal terms, meaning before you adjust for inflation, that is. This is of course just wages catching up to prices. Inflation has soared more than wages if you expand the time horizon on the analysis to a few years. But the central bankers don’t see it that way. They think the wage-price spiral mole is popping up to make them look even more stupid. While claiming that the inflation they caused came out of the blue, they are seeking to solve it by address its symptom. If only central bankers could be sued for economic malpractice. But let’s finally get to what I really want to take about today. The mole which really has popped out of its hole and is about to whack the central bankers of this world on the head, hard. I’m talking about a debt crisis — the other thing which central bankers are hired to prevent, despite being their most prominent cause. You see, the idea that the financial and economic system can handle today’s interest rates is absurd. There is just too much debt in the system. That’s why debt defaults, business failures and all sorts of other debt distress measures are rising across so many different economies. However, higher interest rates take a long time to actually start causing chaos. According to Michael Lebowitz of RealInvestmentAdvice.com, recessions only appear, on average, 11 months after the final rate hike in a cycle. ‘The last Fed hike was in July 2023. Assuming that was the Fed’s final rate increase for this cycle, it may not be until June 2024 before a recession occurs.’ Why the delay? Well, those worst impacted by the higher interest rates are recent borrowers who come off their fixed rate mortgage period. But it takes time for people to roll onto the new rates. Similarly, corporate borrowers borrow at fixed rates for fixed time periods. It takes time for them to need to refinance onto higher rates. The same for governments. Eventually, all of this amounts to less spending to keep the economy growing. Because they eventually all have to tick over to the higher rates. Now recessions are just one form of the consequences of hiking rates too much. The financial panic can begin well before that. Especially when debt is too high and rates are hiked too fast… The debt crisis mole is winding up for a whack. Regards, Nickolai Hubble,
Editor, The Daily Reckoning Australia Weekend PS: STREAMING NOW: What you’re not being told about the greatest energy U-turn in history…it’s the polarising video we had to release…and it reveals how the goal of 100% renewable energy in Australia is impossible. Stream NOT ZERO now and you’ll discover that some of the wealthiest investors in the world have spent the last 18 months quietly loading up on fossil fuel stocks. They’ve figured out what’s coming — and now, so can you. WATCH THE VIDEO HERE… Advertisement: In our most controversial video yet, we make... The Case for Buying
Oil and Gas Stocks You won’t get any Christmas cards from your green or teal friends... But my goodness this could be a smart move... LIMITED TIME: Stream the video here |
|
| A Global Recession? It’s Only a Matter of Time (Part Two) |
 | | By Jim Rickards | | Editor, The Daily Reckoning Australia |
|
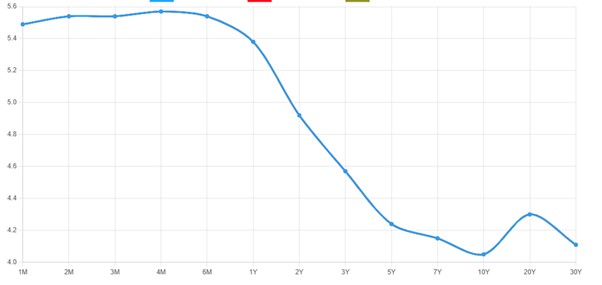
Dear Reader, Let’s consider some of the world’s key economic regions before we untangle what’s really going on. And we’ll start with the US. Some of the factors affecting the US economy were outlined above. Low unemployment, falling inflation, decent GDP (2.4% annualised for the second quarter of 2023) and a surging stock market are certainly enough to cause most investors to sing, ‘Happy Days are Here Again’. What’s not to like? The answer is a lot. There’s not much comfort to be taken from GDP figures, beginning with the fact that they are backward-looking and have low predictive value. GDP grew 2.4% in the fourth quarter of 2019 before crashing 5% in the first quarter of 2020, then an astounding 31.4% in the second quarter. Of course, that crash was COVID-related, but that’s the point. There was nothing about 2.4% growth in late 2019 that told you a pandemic was coming, and there’s nothing about 2.4% growth today that tells you what’s coming next. One has to rely on other time series of data. The same observation can be applied to the current low unemployment rate. The June employment report (most recent available as of this writing) showed job creation of 209,000 jobs for the month of June and an unemployment rate of 3.6%, among the lowest since the 1960s. That’s a healthy report on its face, but there are two serious characteristics that need to be taken into account. The first involves what’s known as the labour force participation rate (LFPR). This counts all of the working-age population of the US who have jobs as a percentage of the total working-age population. That’s different from the unemployment rate because to be counted as ‘unemployed’, you must be looking for a job. There are tens of millions of working-age Americans who do not have jobs but are not looking for one. They are not counted as unemployed, but they do show up in the LFPR calculations. Right now, the LFPR is 62.6%. That’s the same level the US first reached in November 1977, when women were entering the workforce in large numbers. It’s significantly below the 67.2% level reached in January 2001, when baby boomers were in the prime of their careers. This number never gets close to 100%; in fact, a 70% reading is quite high. There are many reasons for Americans not to be in the labour force, including students, homemakers, those recovering from an illness, and others. Still, the drop from 67% to 63% means 4% of a total workforce of 167 million citizens or 6.7 million workers have simply dropped out of seeking work relative to 2001. If those 6.7 million workers were added to the number of unemployed today, the national unemployment rate would be 7.6%, a rate more closely associated with a recession. In effect, the low participation rate is hiding a large unemployed cohort not being counted by the government in the official employment report. Driving a car by looking in the rearview mirror The second and even more critical defect in using employment statistics in economic forecasting is that employment reports are lagging indicators, not leading indicators. When the economy begins to slow down, businesses will do everything except lay off workers to keep the doors open. They will cut inventories, lower prices, seek rent reductions, cut administrative costs, and a lot else before they fire valuable workers. All of those strategies are clear signs of a failing economy, but they do not show up in the employment reports. By the time employers get around to firing workers, it’s too late for the economy. It’s bad for workers and quickly makes the recession far worse, but the damage is already done. Don’t rely on low unemployment rates to conclude all is well. The opposite could easily be true. Still, there are powerful indicators suggesting the US economy is in or near a severe recession, in addition to better-known measures such as the unemployment rate. These indicators are technical and require some explanation but are important to investors. Dead bugs on the windscreen The first leading indicator is an inverted yield curve. A yield curve shows interest rates on securities of different maturities from one issuer, or it can show interest rates on a single instrument at different points in the future. In either case, the curve is normally upward-sloping (longer maturities or later settlement dates have higher interest rates). That makes sense. If you’re lending money for longer, or betting on rates further into the future, you want a higher interest rate to compensate you for the added risk from events such as inflation, credit downgrades, bankruptcy, and more. Incidentally, the recent downgrade of the credit rating of the United States from AAA to AA+ by Fitch Ratings is nothing to cheer about. It is not likely to have much impact on the markets in the short run, but it’s certainly another straw in the wind showing that the US is on a non-sustainable fiscal course that can only end in default, hyperinflation, or protracted depression-level growth. On rare occasions, yield curves become inverted. That means longer maturities (or later settlement dates) have lower interest rates, not higher. This sends a powerful message. It says that investors expect a recession or severe slowdown in growth. The recession will be so strong that it will cause interest rates to drop sharply in the near future. The effect of the economic slowdown risk is greater than the influence of the other market risks previously described. The inverted yield curve today: Yield curves in US Treasury securities are steeply inverted today. So are yield curves in SOFR (formerly eurodollar) futures contracts. These are no casual signals. The last time both yield curves were this steeply inverted was prior to the global financial crisis of 2008. If you’re not factoring this signal into your forecast, you’re missing a five-alarm fire. The system is flashing red. The imbalance sheet Another technical yet powerful signal is a condition known as negative swap spreads. A swap is a simple contract between two parties in which one party agrees to pay a floating rate, and the other party pays a fixed rate based on a specified amount called the ‘notional’ amount. It’s the synthetic equivalent of buying a bond (say, a 10-year Treasury note) and financing it in the overnight repo market. The buyer receives fixed interest (on the bond) and pays floating interest (on the repo). So, a swap is a leveraged bond position — without the bond! Negative swap rates arise when the fixed rate paid on the swap is lower than the fixed rate paid on an equivalent maturity Treasury note. Swaps make sense (they’re off-balance sheet and use up less regulatory capital), but why would you accept a lower rate from a bank dealer counterparty than you could get by owning an equivalent maturity Treasury note? The answer is the one just mentioned — they’re off-balance sheet. Counterparties will take a lower yield to do the trade-off balance sheet (the swap) than on balance sheet (the Treasury note). This means that bank balance sheets are contracting. Balance sheet capacity is strained. That’s another early warning of a credit crunch that presages a recession. There are many other such signs. They’re all technical, and we don’t have the space here to describe them all. It’s enough to say that all of the technical signs are unusual, and all point in the direction of a recession. They all have good track records of predicting recessions going back to the 1970s and earlier, depending on the time series. In the US, the fundamentals (industrial output, global trade, inventory accumulation, credit, commercial real estate) are negative. The technicals (yield curves, swap spreads, bank equity) are negative. The only positives are unemployment (a lagging indicator) and the stock market (a cap-weighted bubble). Unfortunately for investors, stocks and jobs are the only things the financial TV talking heads talk about. Don’t fall for it. All the best, Jim Rickards,
Strategist, The Daily Reckoning Australia | All advice is general advice and has not taken into account your personal circumstances. Please seek independent financial advice regarding your own situation, or if in doubt about the suitability of an investment. |
|
Advertisement: Global Financial Crisis 2.0 Jim Rickards’ latest book is one of the most unsettling things you’ll read this year. Because it predicts the next global financial collapse could happen by the end of 2023. How will you survive if Jim’s right? Click here to find out. |
|
|