According to the 1850 census, there were approximately 3.6 million of what we might today call African Americans in the U.S.
The language was tricky then: Black people fell into three categories: Slaves, who were of course counted as three-fifths of a person, free blacks and mulattoes — the last category added for the first time for the 1850 census.
Then, there were about 160,000 mulattoes, which included mixed-race people in free and enslaved populations.
By the early 1980s, even after the end of legal segregation and the decriminalization of interracial marriage, the Census bureau still struggled to count people who did not fit neatly into a racial box.
"Estimates by sociologists and population researchers of the number of interracial children vary widely, from 600,000 to 5 million and higher. There is no Census Bureau category that counts them," noted the New York Times in a 1984 article in a 1984 article.
"However, the 1980 census showed there were 613,000 interracial married couples in the United States. ... In 1980, 1.3 percent of the nation's 49 million married couples were interracial."
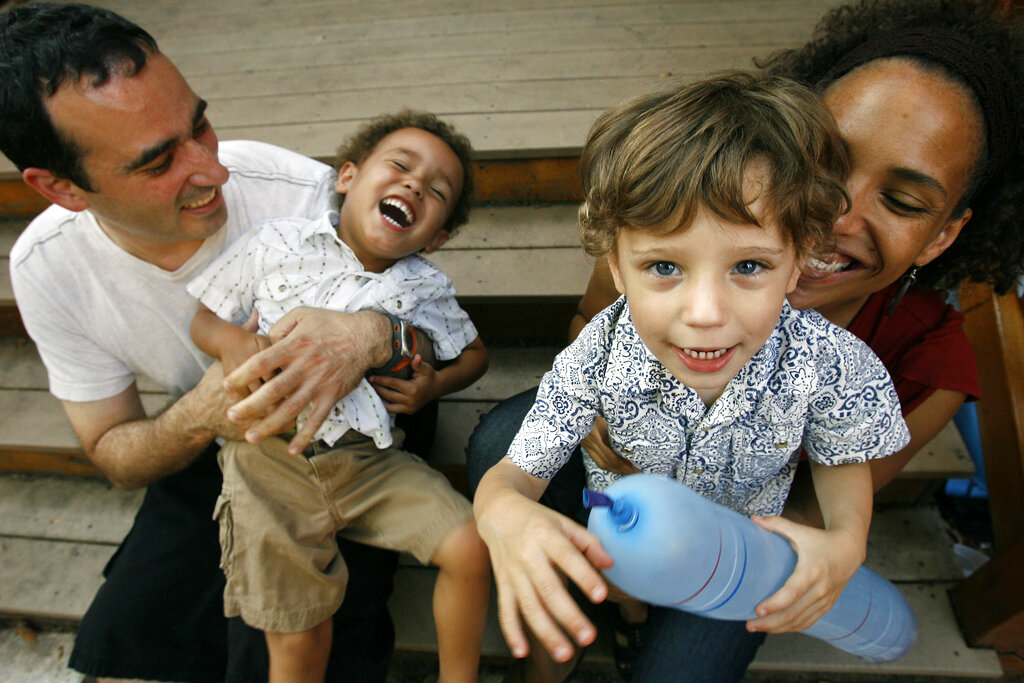
After 2010, several racial-identification categories were added. The result, reflected in the 2020 census, revealed that multiracial population in America has exploded.
Over the previous decennial census, the number of Americans identifying by more than one race had more than doubled. At least 10% of people living in the U.S. hold multiracial identities, and it's possible that the number is even higher.
Election pollsters and other data analysts haven't quite caught up in helping us understand how multiracial people fit into the political landscape. Although, there are several interesting data points that provide some insight into the impact of multiracial people on our elections.
Data points were made:
A 2015 Pew Research Center analysis showed that the political preferences of mixed-race people tended to reflect the larger population.
—About half of multiracial adults ages 18 to 29 say they identify as political independents, neither Republicans or Democrats. They also become more independent as they get older, with 45% of multiracial adults 30-49 identifying as independent compared to 35% of the general population (Pew)
—Among groups studied, biracial adults who are white and American Indian were the only ones that tilted more heavily to the GOP, 53% compared to 42% that leaned Democratic (Pew)
—Conversely, biracial adults who are Black and American Indian were the polar opposite. Among them, 89% favored the Democratic Party (Pew)
—In 2020, the percentage of people who reported multiple races increased from 3% to 10.2% of the population, or 33.8 million people (Census)
—White and Some Other Race was the largest mixed-race classification reported in 2020, around 19.3 million people
—This was followed by white and American Indian and Alaska Native (4 million), white and Black or African American (3.1 million), white and Asian (2.7 million), and Black or African American and Some Other Race (1 million), Census data show
—Mutiracial people are concentrated in the American West, with Hawaii (24%), Alaska (15%), and California (15%) having the highest percentages of multiracial residents (Pew)
—From 2010 to 2020, white and Black or African American population grew by 1.2 million people, a 67.4% increase (Census)
—The white and Asian population increased by 1.1 million people — a 65.8% change in size in the period (Census)
—The Black or African American and Some Other Race population increased by 722,383 people, a 230% change